See your QuickBooks data in dashboards
Tired of text-only QuickBooks reports? We turn your QuickBooks data into graphical, interactive dashboards — and consolidate it with your other systems.
Stop manually exporting data
QuickBooks provides lots of reports — but they're all text in rows and columns, and graphical interactive reporting usually means buying add-on products.
Many clients run property and portfolio accounting in their PMS and use QuickBooks for holding companies or construction and development entities. When consolidated reporting is required, our QuickBooks connector for Power BI or Tableau makes it possible.
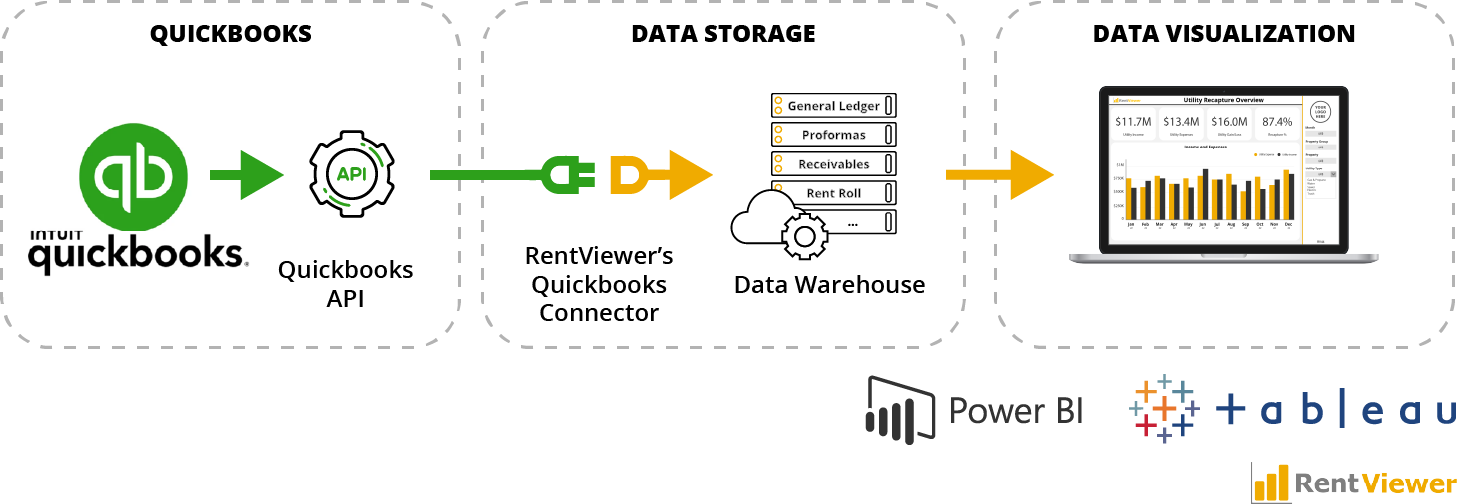
We connect to 20+ popular QuickBooks data sets, including:
Here is How it Looks on Your Computer
Examples of the pre-built dashboards included in the RentViewer subscription. Click any to expand. Extensive customizations are possible.
Getting to your QuickBooks data
Connect via our custom connector
We connect to your QuickBooks data using our custom connector — no manual exports required.
Centralized data warehouse
Your QuickBooks data lands in a centralized warehouse alongside your PMS data, so we can build custom reports and dashboards in Power BI and Tableau.
Consolidate across entities
Combine QuickBooks data from holding companies and development entities with your property management system for a single, consolidated view.
Maintained for you
We keep the warehouse secure, accurate, and updated automatically, handling everything on the back end so you can focus on the business.
Ready to visualize your QuickBooks data?
Call us or book a meeting and we'll walk through the right approach for your portfolio.