Financial
RV66 - Op Ex vs Op Inc
Built for Multifamily · Manufactured Housing · 3rd Party Management
Overview
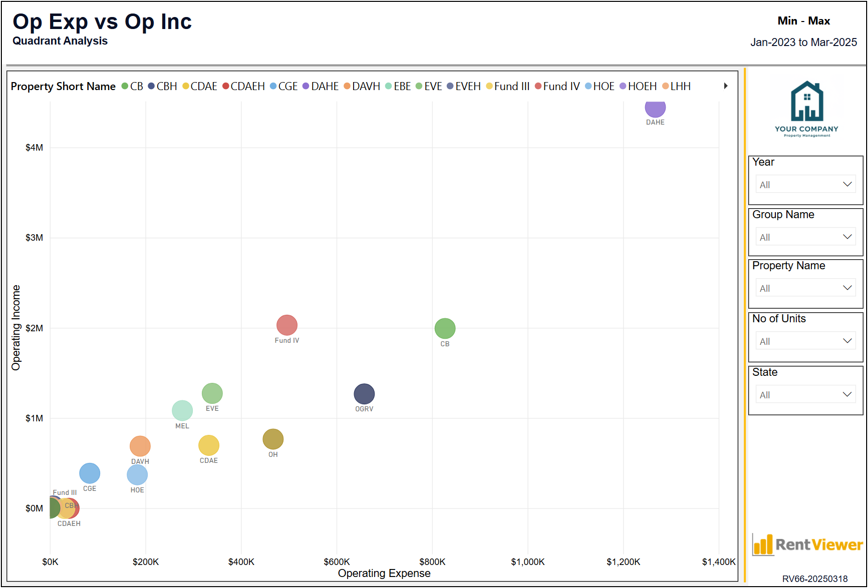
Quadrant analysis comparing operating expenses to operating income across properties. Identify high-margin performers and properties with expense control opportunities.
Problems this solves
- ✓Margin drivers are invisible in flat income statements.
- ✓Expense control opportunities hide in property-by-property detail.
- ✓No visual way to compare operational efficiency across the portfolio.
Key metrics included
•Operating Expense vs Operating Income Quadrant
•High Income / Low Expense
•High Income / High Expense
•Low Income / Low Expense
•Low Income / High Expense
•Operating Margin
•Efficiency Analysis
See this dashboard on your data
Book a 30-minute demo and we'll show you the RV66 - Op Ex vs Op Inc dashboard running live on a portfolio like yours.