Financial
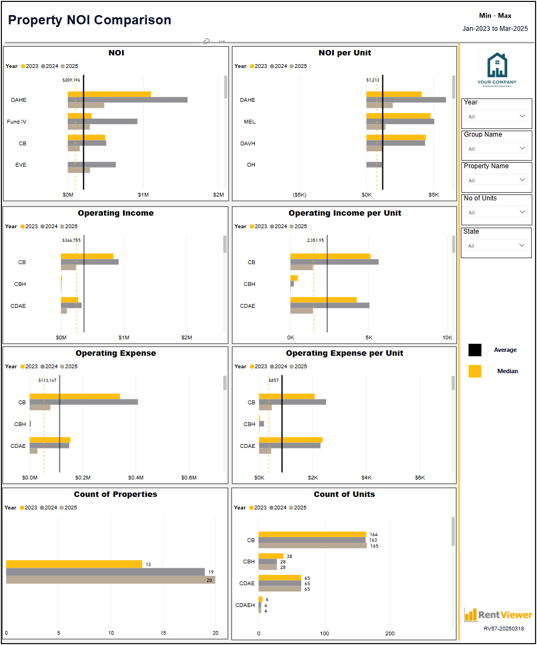
RV57 - Property NOI Comparison
Built for Multifamily · Manufactured Housing · 3rd Party Management
Overview
Benchmark NOI and operating income across your portfolio with per-unit normalization. Identify top and bottom performers and understand what drives the differences.
Problems this solves
- ✓Top and bottom NOI performers are hard to rank quickly.
- ✓Per-unit NOI comparisons require manual math.
- ✓Underperforming properties don't get flagged until board meetings.
Key metrics included
•NOI by Property
•Operating Income by Property
•NOI per Unit
•Property Ranking
•Top Performers
•Bottom Performers
•NOI Margin %
See this dashboard on your data
Book a 30-minute demo and we'll show you the RV57 - Property NOI Comparison dashboard running live on a portfolio like yours.