Financial
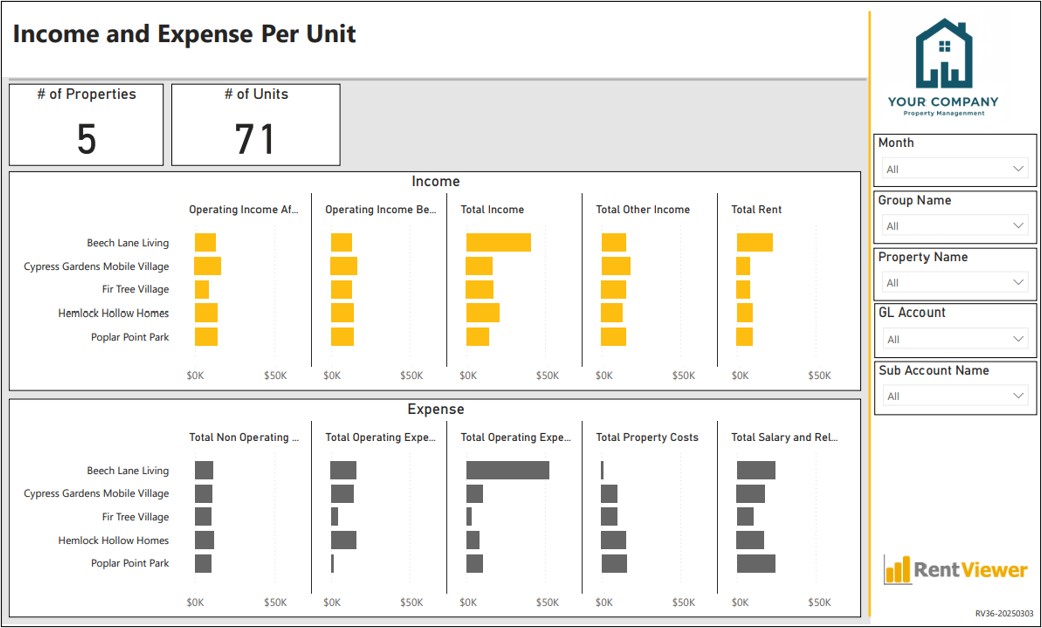
RV36 - Income and Expense Per Unit
Built for Multifamily · Manufactured Housing · 3rd Party Management
Overview
Normalize financial performance across properties of different sizes with per-unit income and expense analysis. Compare apples-to-apples across your portfolio.
Problems this solves
- ✓Can't compare properties fairly because they're different sizes.
- ✓Per-unit metrics require manual normalization every month.
- ✓Hard to spot which properties are truly underperforming.
Key metrics included
•Income per Unit
•Expense per Unit
•NOI per Unit
•Revenue per Door
•Operating Expenses per Door
•Property Comparison (Normalized)
•Unit Economics
See this dashboard on your data
Book a 30-minute demo and we'll show you the RV36 - Income and Expense Per Unit dashboard running live on a portfolio like yours.