Financial
RV16 - Budget vs Actual
Built for Multifamily · Manufactured Housing · 3rd Party Management
Overview
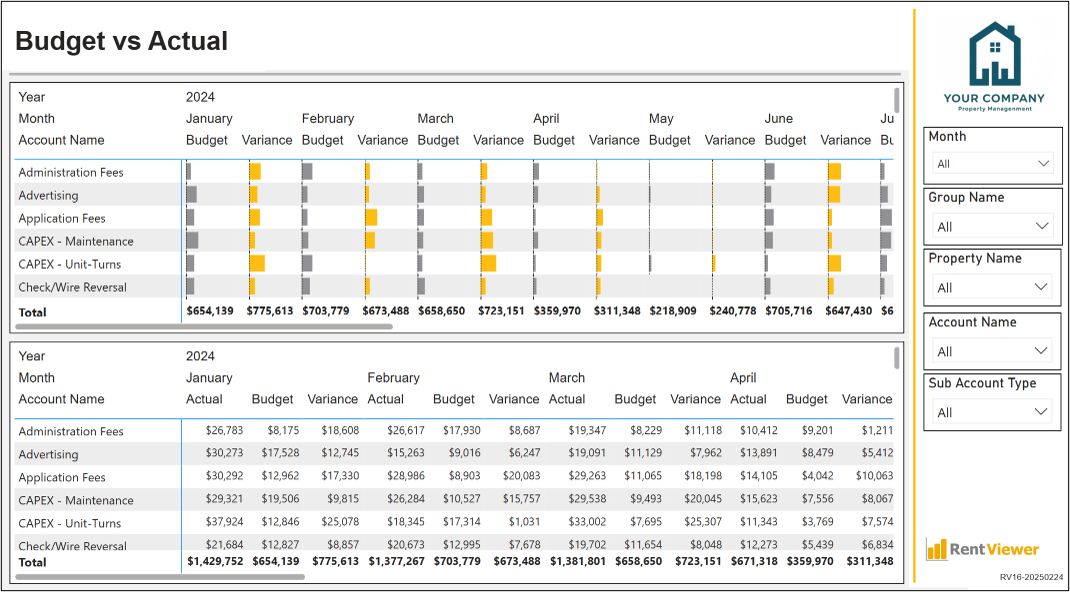
Budget vs actual performance dashboard with visual variance indicators. Quickly spot areas where properties are exceeding or falling short of budget expectations.
Problems this solves
- ✓Variance reports take too long to build each month.
- ✓Properties drift off budget without anyone catching it.
- ✓Executives want visual variance indicators — current reports are all numbers.
Key metrics included
•Actual vs Budget Comparison
•Variance Percentage
•Revenue Variance
•Expense Variance
•NOI Variance
•Property-Level Performance
•Visual Variance Indicators
See this dashboard on your data
Book a 30-minute demo and we'll show you the RV16 - Budget vs Actual dashboard running live on a portfolio like yours.